

A Data-Driven Analysis of How to Win the 2025 AZ Congressional District 7 Democratic Special Primary Election
TLDR: The 2025 AZ CD7 dem special primary background, identifying voting KPIs for candidates to achieve in order to win, and a data-driven approach to achieving those metrics with data vizzes

To see the data visualizations shown below and utilized for the analysis, click here.
The Background
Early voting started on June 18th for the July 15 Arizona Congressional District 7 Special Primary Election, which will determine Democratic and Republican nominees for November’s general election. Since redistricting in 2020, this district spans across central to western AZ, along the Mexico border, covering all of Agua Prieta and Nogales, the majority of Tucson and Yuma, and even some parts of Maricopa County, making this a rather sprawling and oddly assembled district covering 6 counties: Cochise, Maricopa, Pima, Pinal, Santa Cruz, and Yuma.
")
Since 2022, CD7’s seat has been held by Democrat Raúl Grijalva, a longtime rep of the previous CD3 which included many similar areas. However, Grijalva passed away due to cancer complications on March 13, 2025, thus triggering this special election. He won the most recent 2024 election handily, by a margin of 72,897 votes, or 26.4 percentage points.
When examining January 2025 AZ registered voter data from my dashboard, Democrats hold a clear advantage. Among “active”1 2024 voters: there were 130,796 Democrats (47.15%), 68,671 active Republicans (28.10%), and 77,955 active independents. This Democratic advantage explains why money is flooding into this contested Democratic primary—the winner will likely win the general election.

Out of the 5 candidates running in the primary, there are 2 primary candidates and 1 dark horse candidate to mention:
Adelita Grijalva
Raúl Grijalva’s daughter who was on the Tucson Unified School District (USD) board for 20 years and the Pima County Board of Supervisors for 4 years
Daniel Hernandez
A former state rep and former Sunnyside USD board member
Deja Foxx
A social activist who has organized various initiatives and gained initial prominence for this confrontation of former US Senator Jeff Flake
With the stage set, let’s dive into the data to explore a potential path to victory! 🤓 This analysis doesn’t focus on specific candidates, messaging, or persuasion. Instead, it takes a consultative lens—examining which populations and precincts appear most decisive, and where outreach might yield the greatest return on investment (ROI). With over 30,000 ballots having already been returned by July 3rd, these insights are best suited to shape strategy at the outset of a race—well before ballots go out. This data-informed strategy is not meant to make particular tactical suggestions, but rather maximize the campaign professional’s chance of success and empower them to make the outreach decisions that are best for their campaign.
The Data-Driven Analysis for How to Win
Setting Goals
When analyzing historical data for strategy, I must acknowledge the uniqueness of this special 2025 primary race. History (and Wikipedia) tell us that turnout will be lower in this off-year election and typically primary elections are voted in less than general elections. While Democratic voters may be more motivated by the historic unpopularity as well as the mere presence of Trump in the presidency, this will likely boost general election turnout more than primary turnout. Additionally, AZ is an "Open Primary" state, meaning that voters who are independents or have no party preference can vote for a party of their choice in a primary election.
With likely lower voter participation in this race and each vote being potentially more important as a result, let’s start by identifying how many votes a candidate would likely need to win the election, where their “target” outreach population lives, and how they vote. I believe the best population to examine would be active registered voters who participated in the 2024 general election, and in both the 2022 and 2024 Democratic primaries because:
These voters are active and participated in the most recent election.
They have a history of voting in the last two Democratic primaries—2022 being a non-presidential, non-contested primary year and 2024 being non-contested.
For these past primaries, Grijalva received 62,457 votes in 2022 and 55,133 votes in 2024, providing benchmarks to validate our targets.

Using the same dataset from Visual 2, filtered to active registered independent or Democratic voters who cast ballots in 2024 and are eligible in 2025:
208,751 registered Democratic or independent voters voted in the 2024 general election who could vote in the AZ CD7 primary. Of these, 58,851 voted in the 2024 democratic primary and 60,653 voted in the 2022 democratic primary.
The number of current registered democrats within those larger numbers is displayed in the sub-caption.
41,157 voters participated in both the 2022 and 2024 Democratic primaries and the 2024 general election across CD7's 202 precincts. These are the "highly probable voters"—the most important outreach targets given their likelihood to vote.
Based on past primary turnout, a candidate would likely need 29,876 votes to win—approximately 148 votes per precinct. This represents 50% of the average total votes from the past two primaries ((58,851 + 60,653) / 2 = 59,752).
With this calculation complete, let’s ask ourselves does the 29,876 vote count goal make sense? 62,457 total votes were cast in 2022 and 55,133 total votes were cast in 2024 with only Grijalva running, so if we take half of each of those totals they would average 29,398—our goal is 478 votes higher, which is reasonable with three candidates splitting the vote.
For timing strategy: 92.10% voted early in 2024's primary and 93.67% in 2022's primary. Given the historical early voting rates, a winning candidate might expect to secure around 27,685 early votes2 (92.67% of the 29,876 goal). Of the 41,157 highly probable voters, 38,553 (93.67%) voted early in all 3 elections and 38,307 (93.08%) are on the Active Early Voting List (AEVL)—making AEVL voters the top outreach priority.
Summary: The path to 29,876 votes runs through the 41,157 highly probable voters, the vast majority of whom consistently vote early.
Achieving the Goals
Beyond prioritizing digital/mail/phone/etc. outreach to the highly probable voter population, analyzing the distribution of the 41,157 highly probable voters (and 38,307 AEVL voters) can offer insights into where geographically-focused efforts—like canvassing, advertisements, events, etc.—might have the most impact. Since ~148 votes per precinct is the estimated threshold, precincts with denser populations of highly probable voters voters offer higher potential ROI on outreach efforts.
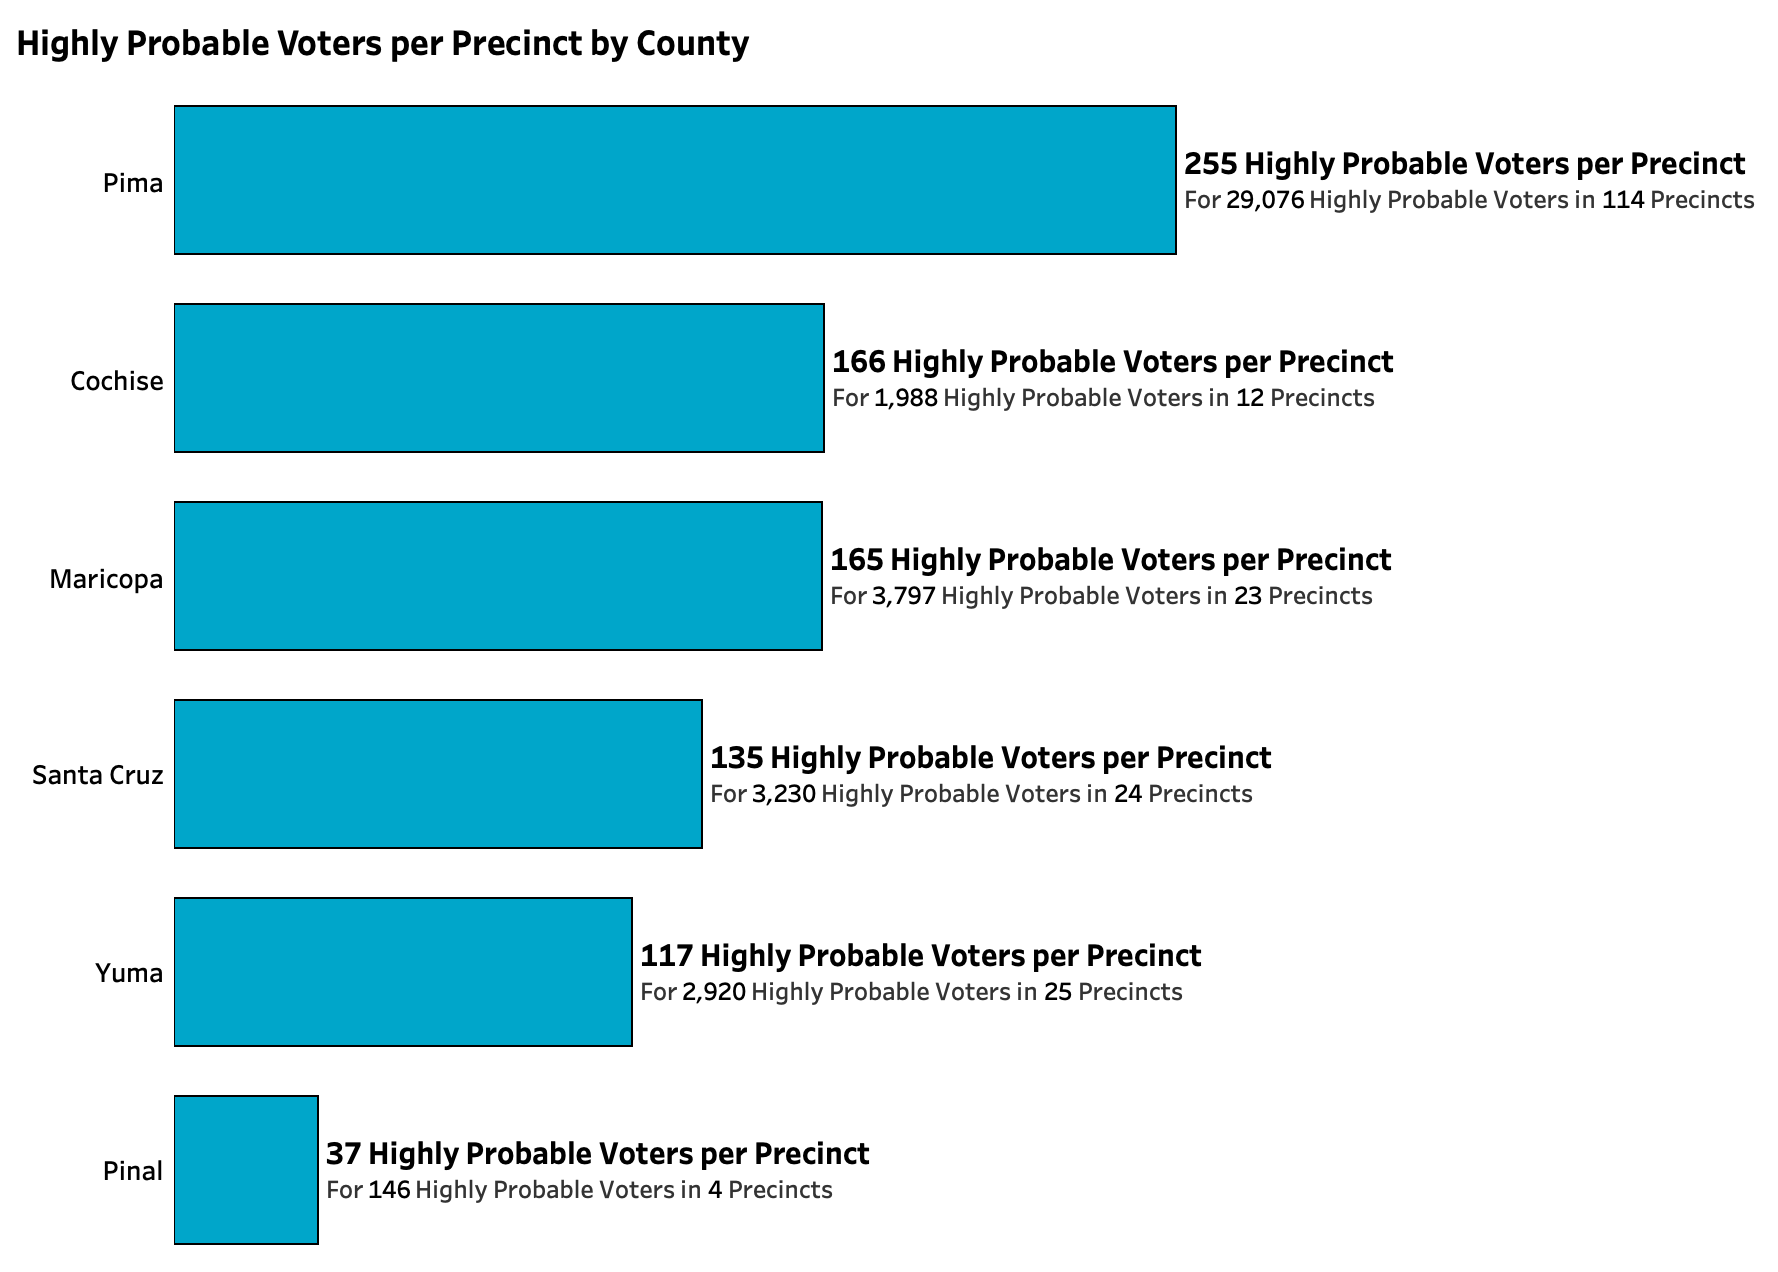
Pima County has the highest concentration of highly probable voters at 255 per precinct and 28,089 total across 114 precincts, making Tucson and its metro areas crucial for victory. However, even capturing all Pima County highly probable voters won't reach the 29,876 threshold—additional counties are needed.
Two other counties exceed the 148 votes per precinct benchmark: Cochise at 166 voters per precinct (1,888 total) and Maricopa at 165 voters per precinct (3,604 total).
The pattern holds for current AEVL voters: Pima leads at 247 per precinct, followed by Maricopa at 160 and Cochise at 159.

State legislative districts (LDs) provide a slightly different geographic perspective as they span across counties. When filtering for current AEVL or all voters, there are 6 state LDs that exceed the votes per precinct benchmark, but their distribution across total highly probable voters is varied amongst the 9 LDs that comprise CD7. For 5 out of the top 6 most dense LDs, 26,783 (86.56%) voters are from Pima County out of the 30,935 total voters. All 3,727 voters from LD22 come from Maricopa County.
LD20 is the most populous LD at 13,873 highly probable voters and the 2nd most dense at 289 highly probable voters per precinct. However, LD21 is the 2nd most populous at 12,096 voters but 5th in density with 205 voters per precinct, and LD23 is 3rd most populous at 5,246 voters but 8th in density with 107 voters per precinct. Less dense LDs such as LD21 and LD23 may pose greater logistical challenges for in-person outreach if not broken down further by precinct.

Examining CD7 at the precinct level, the top 83 precincts contain 29,939 highly probable voters (averaging 361 per precinct), clearing the 29,876 vote threshold.
The top 12 precincts come from 4 LDs and are all in Pima County with 7,126 highly probable voters. Of the 83 selected precincts, 64 come from Pima (out of its 114 total precincts). Maricopa contributes 8 precincts, all from the Goodyear and Tolleson areas. Santa Cruz adds 5 precincts, Cochise has 4, Yuma contributes 2, and Pinal has none. LDs are a little more dispersed, though 59 precincts come from LD20 (32) and LD21 (27), with five other LDs between 8 to 1 precincts.

Expanding to all precincts with 148+ probable voters increases the count by 29 from 83 to 112 precincts, boosting total probable voters by 4,896 from 29,939 to 34,835. This adds 15 more Pima precincts, 5 more from Maricopa, 5 more from Yuma, and 2 more from Santa Cruz. LDs remain dispersed in a similar way, with LD20 at 39 precincts, LD21 at 32 precincts, LD23 at 14 precincts, LD22 at 13 precincts, and the four other LDS between 8 to 1 precincts. The average highly probable voters per precinct drops from 361 to 311.
The biggest takeaway: Pima County contains 26,664 highly probable voters—76.54% of the 34,835 total.
The story is clear: the Pima County precincts around the central, south, and west metro areas of Tucson will be key for victory. This area has the most highly probable voters overall and the highest density per precinct. While other counties may matter less numerically, all counties except Pinal have pockets of relatively dense populations that may offer higher ROI when attempting to reach the 29,876 vote goal. This pattern holds when filtering for AEVL voters—no notable geographic shifts occur.
What to Monitor, Potential Areas for Improvement, and Conclusion
Over the next few days until July 15th when the election is decided, here are some questions I’ll be monitoring relative to my hypotheses:
How many votes were cast (early v. otherwise) and what will the winning threshold be?
I established my threshold at 29,876 (27,685 early votes) out of 59,752 total estimated votes.
How many of the top 12 precincts by votes cast coincide with the top 12 precincts I highlighted above?
The Pima County precincts in order from highest to lowest by highly probable voters are Precincts 73, 41, 166, 16, 153, 92, 86, 96, 21, 82, 23, and 80.
Will the candidate that wins the Tucson-area win the race?
26,664 highly probable voters live in precincts in Pima County that contain 148 highly probable voters or more.
These 3 questions and more set up a follow up article 🤓, where I will analyze what aligned or did not align with what I observed above and why. And while my analytical process accounts for many variables, several improvements could enhance it:
This analysis uses AZ voter registration data from January 2025. Ideally, this could be conducted with as recent data as possible.
I did not consider factors beyond voting history and registration that could affect this race—voter demographics, polling, candidate characteristics, outreach strategies, and other variables could change turnout and target vote numbers.
More specific data science modeling might be able to offer increased precision for target vote thresholds.3
Despite these limitations, the analysis provides clarity and a data-driven approach to creating goals and thresholds that likely lead to victory in this special election. However, to maximize the effectiveness of a data-driven strategy, this analysis should be completed early on in a campaign’s life. As it does for many other contests, this analytical process breaks down into three steps for this CD7 race:
Establish and review historical benchmarks and voter turnout goals.
The estimated winning threshold is 29,876 votes, or 148 votes per precinct on average.
Identify the ideal outreach population that is most likely to help reach that goal.
Our target population is the 41,157 highly probable voters, or voters who voted in the democratic primaries in 2022 and 2024, and who voted in the 2024 general election.
38,307 of these 41,157 highly probable voters are on the AEVL.
Identify areas with dense concentrations of the ideal outreach population that offer the highest potential ROI for geographically targeted engagement.
112 precincts have 148 highly probable voters or more for a total of 34,835 highly probable voters and 311 highly probable voters per precinct.
79 precincts in Pima County contain 76.54% of those 34,835 highly probable voters with the densest precincts centering around central, south, and west Tucson.
In 5 out of the top 6 most dense LDs, 26,783 (86.56%) are Pima voters.
In the spirit of continuous improvement and given this is my first article, if you have thoughts, questions, or feedback about this article, I invite you to comment below or DM me!4 Please share this if you enjoyed it, and thank you for reading and see you again soon!
An "active voter" generally refers to a voter who is registered and whose registration record is current and in good standing, allowing them to participate in elections.
The dashboard has a filter to display for early, provisional, or polling place votes.
This might include regression analyses analyzing each individual voters’ probability of voting, or cluster analyses that segment voter populations into different categories.
For business inquiries, please email info@efishent.co or submit a form on efishent.co.